☀️ Gujarat’s Leading Solar Installers – Book Your Free Consultation Today!

3 Critical Solar Metrics Your Technical Team Overlooks (And How to Fix Them)

3 Critical Solar Metrics Your Technical Team Overlooks (And How to Fix Them)-1

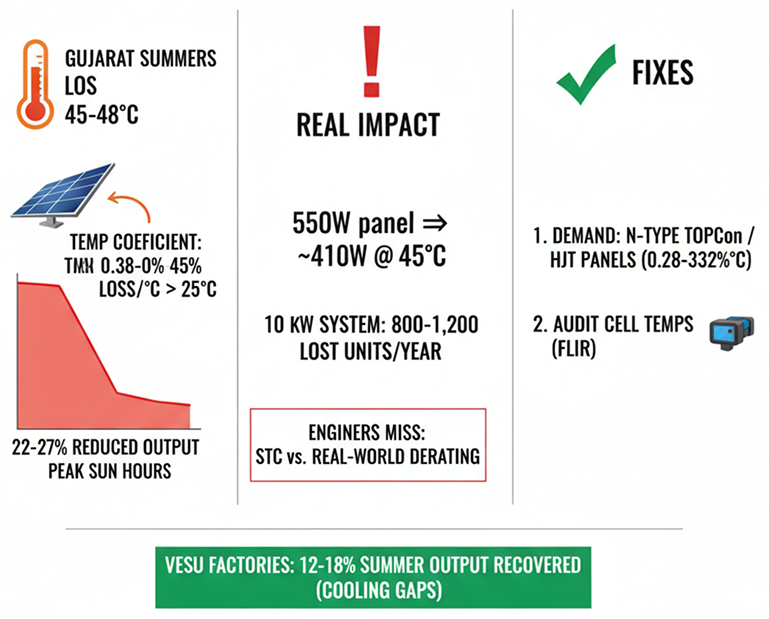
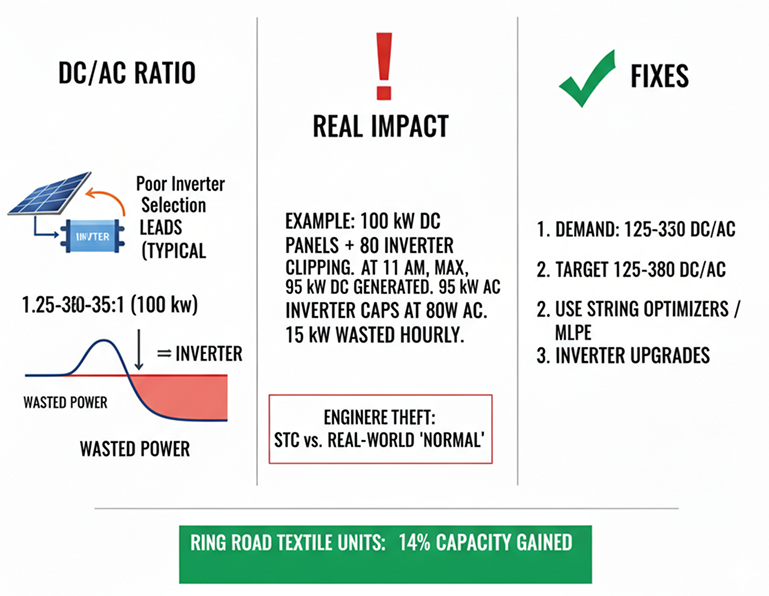
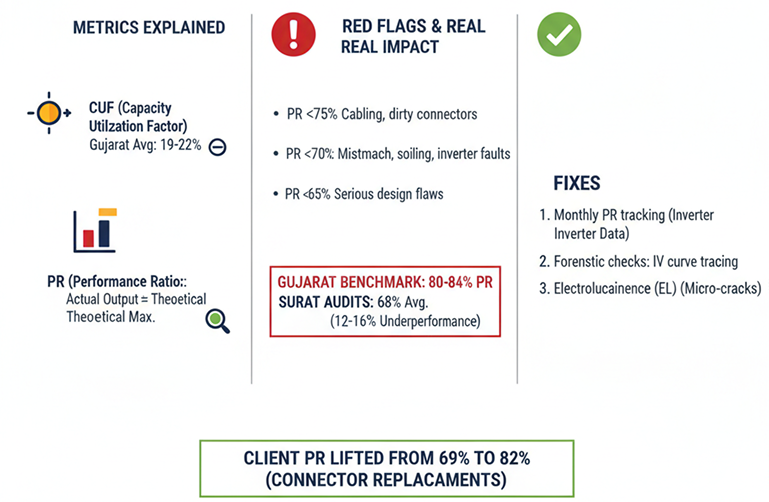
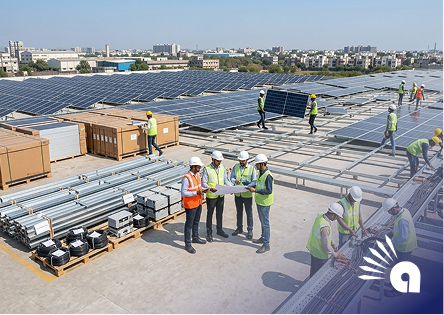
Homeowners and factory owners in Gujarat often tell me the same story. Their solar company engineer visits, glances at the inverter screen, and declares “Everything’s perfect.” But their bills haven’t dropped as expected, and production feels… off. After auditing over 100 systems around Surat, I’ve seen this pattern repeatedly—hidden technical losses stealing 15-25% of potential output.

The issue isn’t incompetence (usually). It’s focus. Engineers prioritize uptime over optimization. Under Solar Policy 2026 India, DCR solar panels and ALMM list compliance get attention, but three key metrics get ignored. Understanding these separates good systems from great ones. Here’s what to check—and fix.
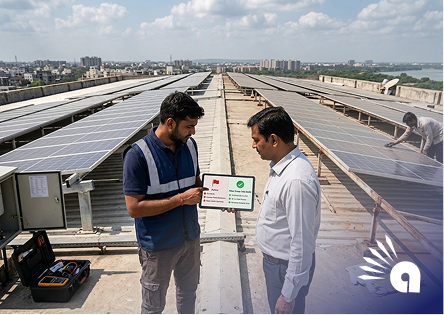
1. Thermal Coefficient: Heat Steals Your Peak Summer Output

Gujarat summers hit 45-48°C. Every solar panel has a temperature coefficient-power loss per degree above 25°C. Most mono PERC panels lose 0.38-0.45% per °C. At 45°C cell temperature, that’s 22-27% reduced output during peak sun hours.


Real impact: Your 550W panel produces ~410W at noon in April. Over summer, that’s 800-1,200 lost units/year for a 10 kW system.

What engineers miss: They quote STC (Standard Test Conditions: 25°C) ratings but skip real-world derating. Clients discover this when monsoon yields exceed summer.

Fix: Demand N-Type TOPCon or HJT panels (0.28-0.32%/°C coefficient). Better yet, audit cell temps via FLIR thermal imaging. We’ve recovered 12-18% summer output for Vesu factories by adding panel-level cooling gaps.

Thermal Coefficient Heat Steals Your Peak Summer Output

2. DC/AC Clipping Loss: Inverter Bottlenecks Waste Peak Power

DC/AC ratio (or DC oversizing) balances panel capacity vs. inverter capacity. Engineers typically size 1.2-1.3:1 for Gujarat’s sun. But poor inverter selection clips excess DC power during peak hours.

Example: 100 kW DC panels + 80 kW inverter. At 11 AM (max production), panels generate 95 kW DC. Inverter caps at 80 kW AC-15 kW wasted hourly.

Annual theft: 1,200-1,800 units for commercial systems. Engineers call this “normal clipping.” It’s not.

Fix: Target 1.25-1.35 DC/AC for flat tariffs. Use string optimizers or MLPE (Module Level Power Electronics) on shaded strings. Post-audit, Ring Road textile units gained 14% capacity via inverter upgrades.

3. Performance Ratio (PR) vs. CUF: Quality vs. Quantity

Engineers love CUF (Capacity Utilization Factor)—% of rated capacity actually produced. Gujarat averages 19-22%. But PR (Performance Ratio) reveals system quality: actual output ÷ theoretical maximum from sunlight received.

Red flags:

  • PR <75%: Cabling losses, dirty connectors
  • PR <70%: Mismatch, soiling, inverter faults
  • PR <65%: Serious design flaws

Gujarat benchmark: Healthy systems hit 80-84% PR. Surat rooftop audits show 68% average-12-16% underperformance.

Fix: Monthly PR tracking via inverter data. Forensic checks: IV curve tracing, electroluminescence (EL) imaging for micro-cracks. We’ve lifted client PR from 69% to 82% via connector replacements.

Performance Ratio (PR) vs CUF Quality vs. Quantity

Bonus: Soiling Gradient Analysis Engineers Skip

Weekly cleaning doesn’t cut it. Soiling gradient—dust buildup patterns—creates hot spots and bypass diode activation. Bottom-edge dust (from gravity) drops string voltage 5-10%.

Audit finding: 2-3mm dust layers cause 8-12% loss. Water salts from hard water cleaning etch permanent 3-5% degradation.

Fix:

Harmonic Distortion: The Silent Equipment Killer

Poor inverters inject harmonics-electrical noise stressing motors, VFDs, PLCs. THDi >5% (Total Harmonic Distortion current) cuts equipment life 20-30%.

Factory symptom: “Our motors fail early, but solar tests fine.” Harmonics don’t trip safety systems-they degrade gradually.

Fix: Demand THDi <3% inverters. Active filters for textile/diamond units. One audit found 8.2% THDi causing ₹3.2 lakh annual motor repairs.

Realistic Audit Results from Gujarat Systems

Metric FixedTypical LossRecovered OutputAnnual Value (₹7.5/Unit)
Thermal Optimization18–25%12–16%₹85k–1.2L (10 kW)
DC/AC Rebalancing10–15%8–12%₹65k–95k (10 kW)
PR Enhancement12–18%10–14%₹75k–1L (10 kW)
Soiling Optimization6–12%5–9%₹35k–65k (10 kW)

Total potential: 35-55% uplift for underperforming systems.

Questions to Ask Your Solar Engineer Today

No answers? Time for a second opinion.

Checklist: Audit-Ready Solar Under Solar Policy 2026

Anany Urja specializes in these forensic audits-recovering lost generation without hardware changes. We’ve boosted Surat systems 18-27% post-Solar Subsidy 2026 installs.

FAQ: Solar Performance Metrics Decoded

What's more important: CUF or PR?

PR. CUF measures quantity, PR measures quality. Target 82%+ PR for rooftop solar Gujarat.

How do I calculate my system's PR?

PR = (Actual kWh ÷ (Peak Sun Hours × kW Capacity)) × 100. Inverter apps track this daily.

Can thermal imaging find hidden problems?

Yes-hot spots, bypass diodes, string mismatches show as 8-15°C hotspots.

Does cleaning frequency matter more than method?

Method. Bottom-up strokes + DI water prevent 90% of soiling losses vs. weekly spray-downs.

WillSolar Policy 2026 India improve engineering standards?

DCR solar panels ensure quality, but optimization remains installer-dependent.

Suspect hidden losses in your solar? Book a technical audit at ananyurja. Share your PR/CUF numbers below-I’ll benchmark them.

Inquiry Now